

InsightDesk AI turns scattered business data into an always-on AI data analyst

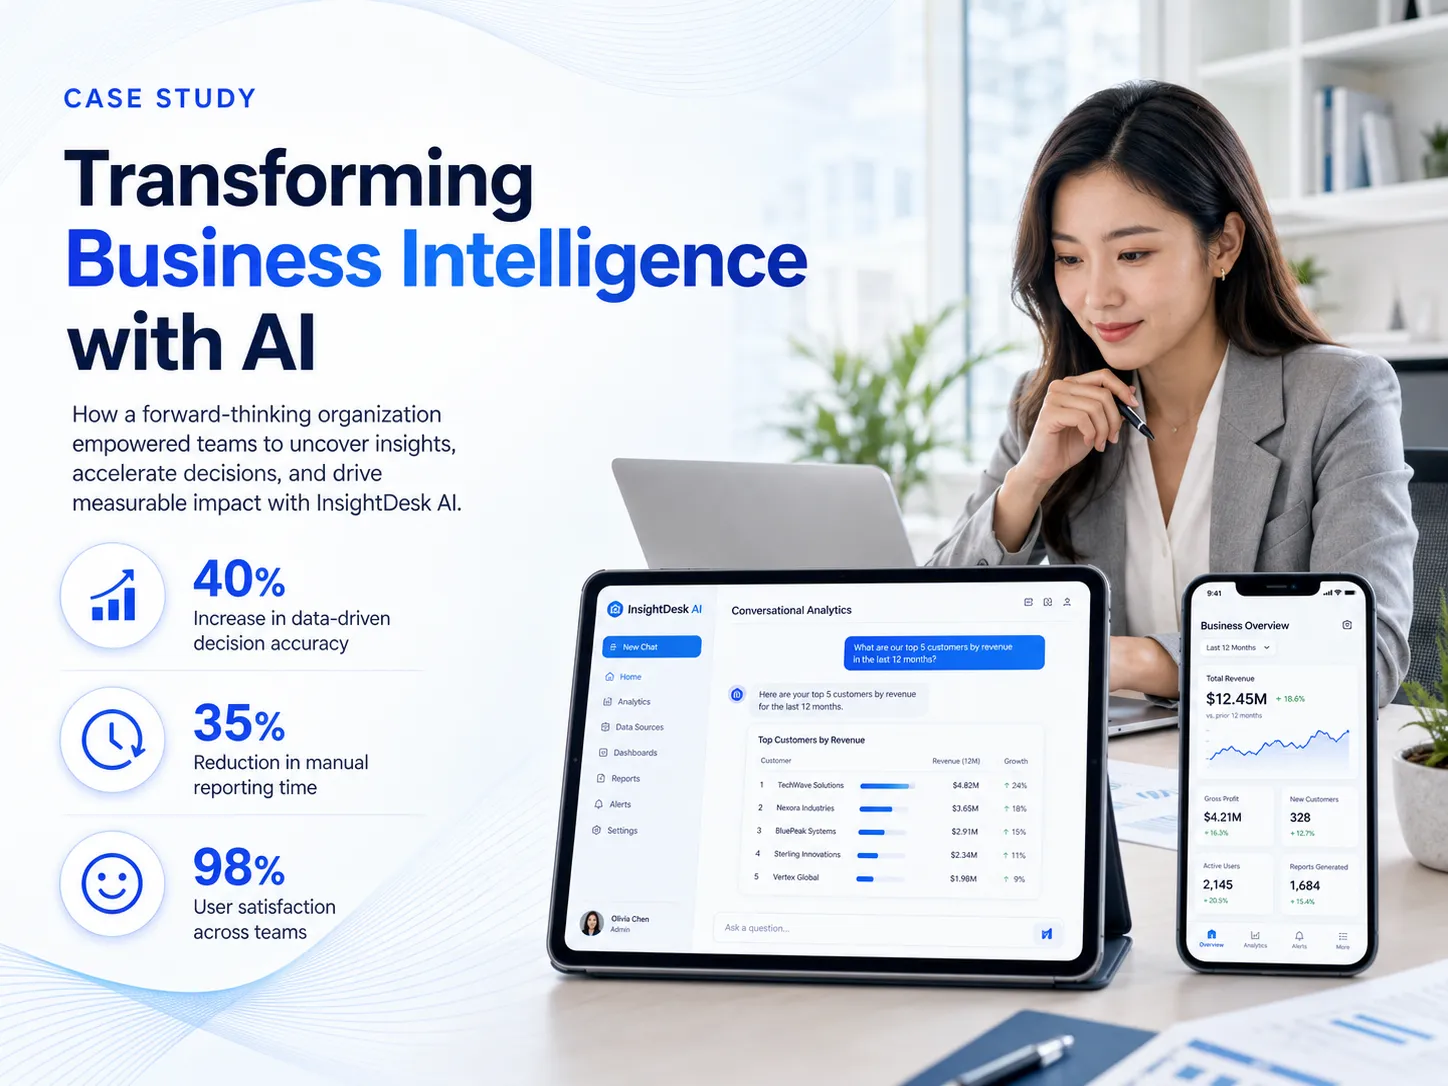
AblyCode designed an AI-powered data analyst platform that helps business users ask questions in plain English, generate charts and tables, explore trusted business data, and export reports without waiting for manual analysis. Built as an AI-native analytics layer, InsightDesk AI combines conversational analysis, governed data access, role-based permissions, chart generation, export workflows, query history, and data-source governance in one operating system for modern business teams.
InsightDesk AI Screenshot 1InsightDesk AI Screenshot 2InsightDesk AI Screenshot 3
Header image
Industry
AI / Business Intelligence / Data Analytics
Services
  • Technology consulting
  • Product strategy
  • UI/UX design
  • Software engineering
  • Generative AI integration
  • Data engineering
  • Cloud / DevOps
  • QA services
  • Application management
Team
  • Product strategist
  • Lead engineer
  • AI engineer
  • Data engineer
  • Full-stack developers
  • UI/UX designer
  • QA engineer
  • DevOps engineer
Results
Faster self-service reporting, reduced dependency on manual analysis, improved access to trusted business insights, and more consistent decision-making across teams.

AblyCode helped us turn reporting from a slow request-based process into a self-service analytics experience. What stood out was their ability to combine AI, product thinking, data governance, and practical business workflows into a platform that our teams could actually use every day.

Chief Data Officer

About InsightDesk AI: a conversational analytics layer for business teams

Business teams usually work across fragmented data sources: spreadsheets, BI dashboards, CRM tools, finance reports, data warehouses, product analytics tools, and manually prepared presentations.
The result is familiar: leaders ask simple business questions, but teams still need analysts, exports, filters, spreadsheet work, and repeated follow-ups to reach the real answer.
InsightDesk AI was imagined as a response to that problem.
Instead of adding another static dashboard to an already crowded reporting stack, the platform acts as an AI-powered analytics layer. Business users can ask questions in plain English, receive answers as charts or tables, drill into follow-up questions, and export results for meetings.
The system keeps data governance at the center. Users only see what they are allowed to access. Answers are generated from approved data sources. Query history, audit logs, and source visibility help teams trust the output.
Human teams remain in control, but reporting friction gets compressed dramatically. The result is a system that helps business teams move from questions to insights faster without losing governance, visibility, or data quality.

InsightDesk AI x AblyCode: what the platform includes

Over time, AblyCode would shape InsightDesk AI as a modular analytics platform with conversational workspaces, governed data connections, chart and table generation, export workflows, and admin controls that fit into a modern business intelligence environment.

Milestone 1:
Plain-English Analytics Workspace

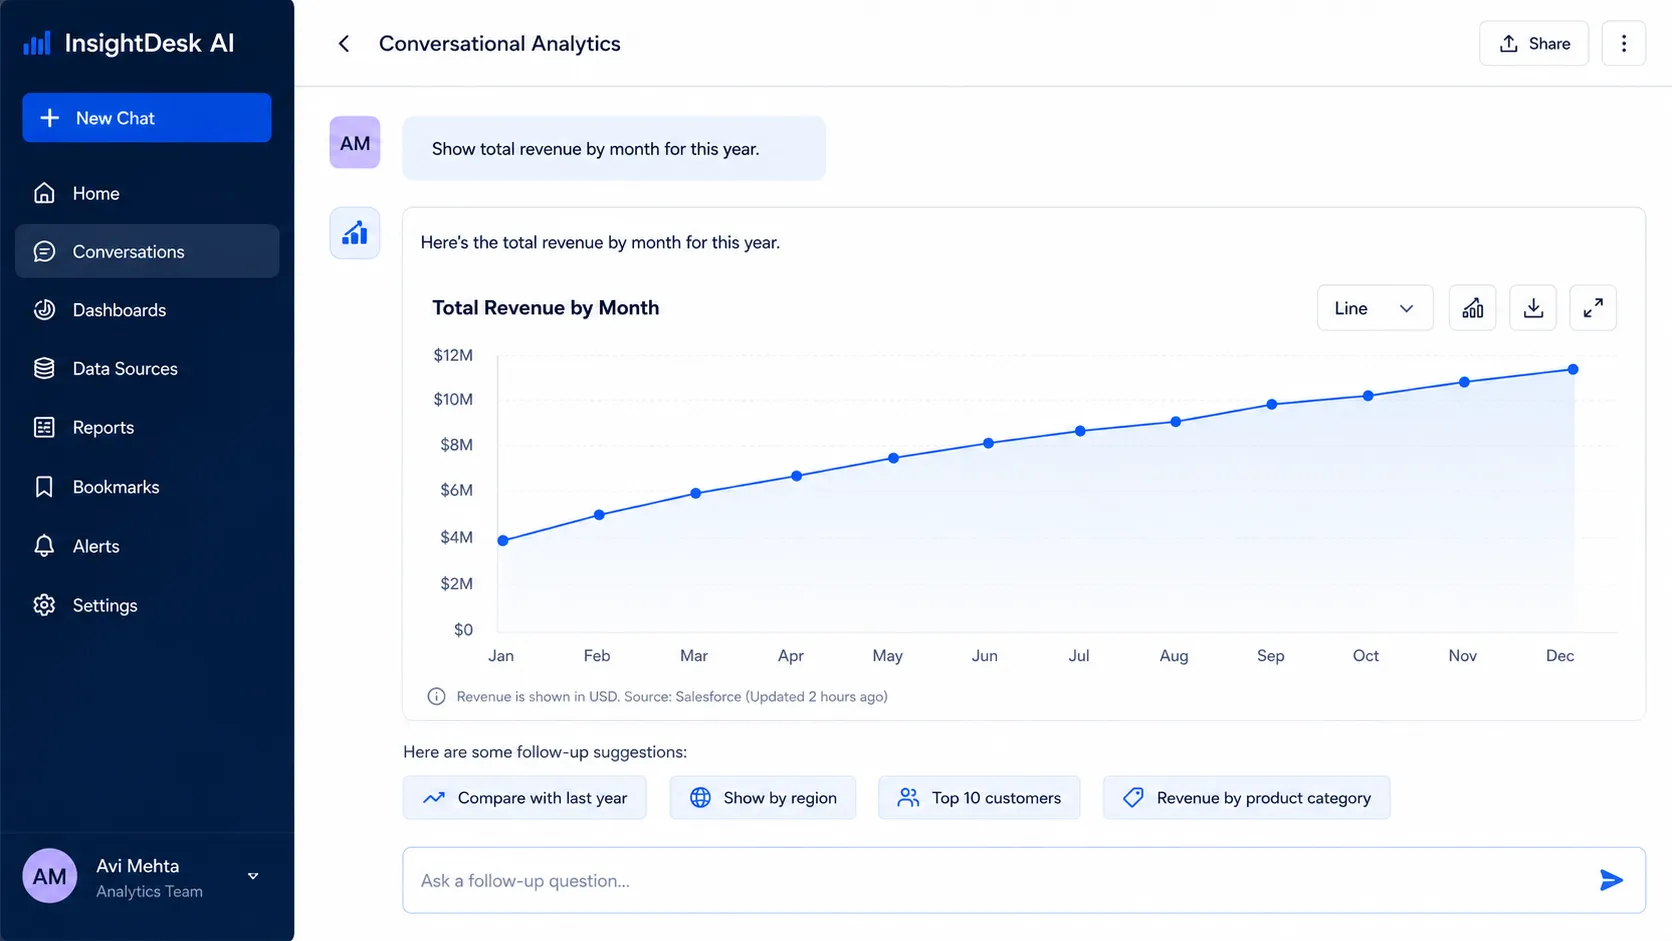
The first layer of the platform helps business users ask questions without needing SQL, dashboard filters, or analyst support. A user can type a business question, choose a suggested prompt, or continue from a previous conversation.
The AI analyst interprets the question, identifies the relevant data source, applies approved metrics, and returns an answer in a business-friendly format.
Result: Faster access to business answers, lower reporting dependency, simpler data exploration for non-technical users.
What we did:
  • Designed a conversational analytics workspace where business users can ask plain-English questions and receive structured answers.
  • Built prompt flows for common business questions such as trends, comparisons, rankings, breakdowns, and summaries.
  • Created suggestion chips and supported-question examples to help users start analysis without technical knowledge.
  • Added conversation history so users can return to previous analysis threads and continue working from context.

Milestone 2:
Governed Data Access and Source Management

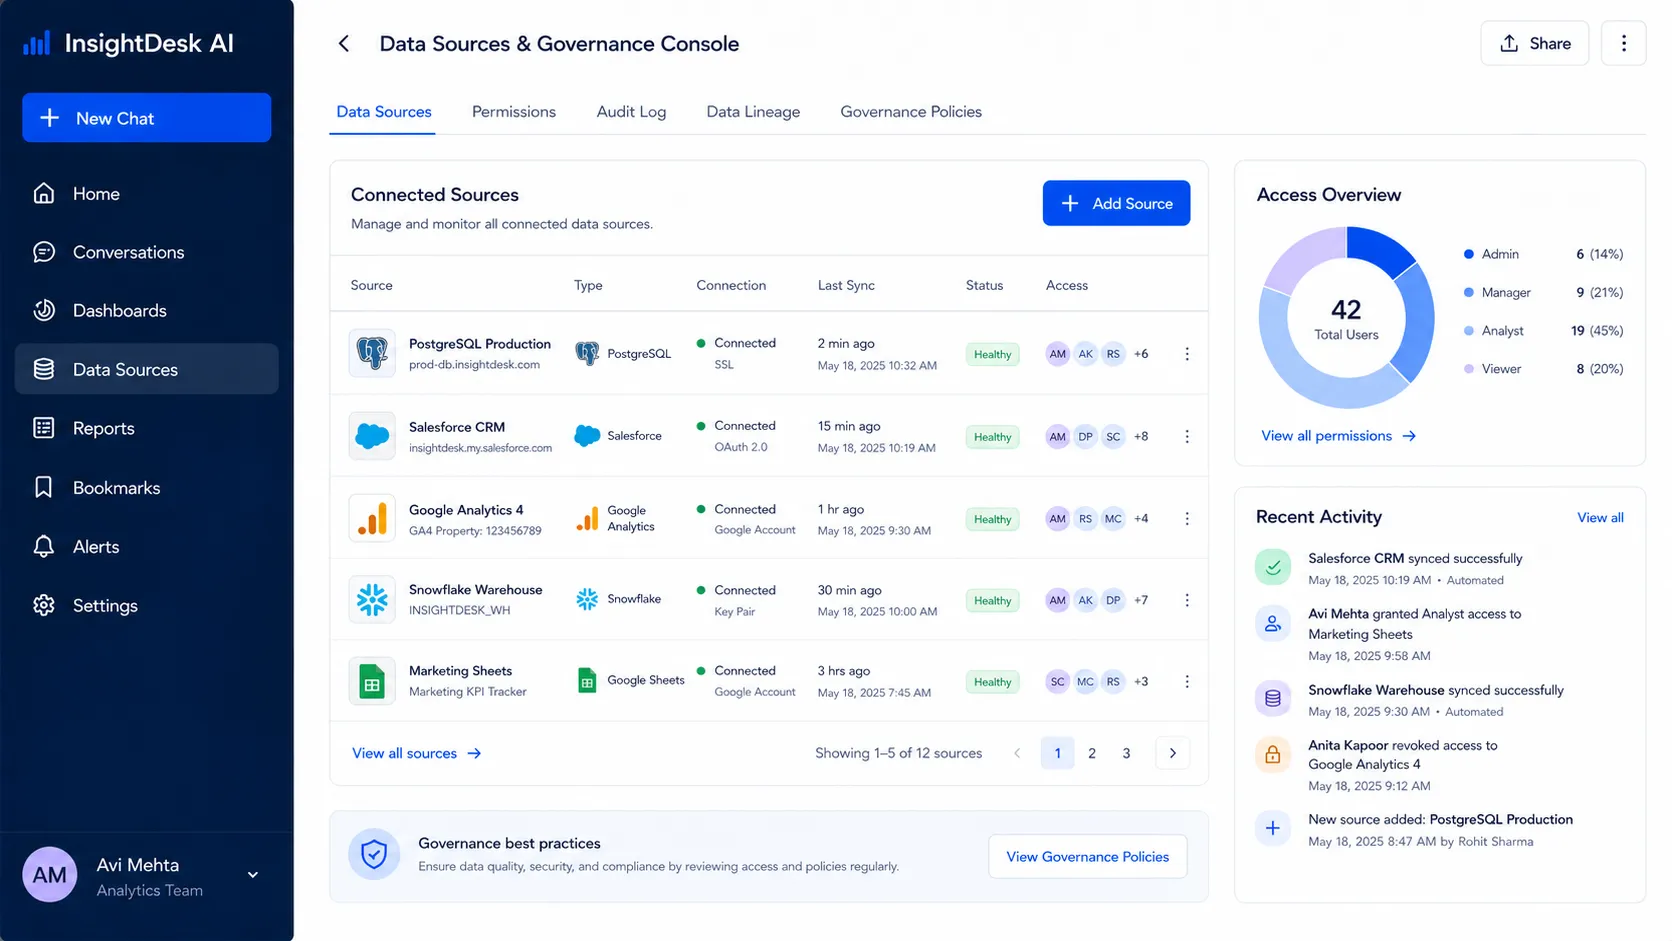
Business analytics only works when users can trust the data. InsightDesk AI includes a governed data-source layer where approved databases, APIs, spreadsheets, and analytics systems can be connected and managed.
The platform uses role-based access so each user sees only the data they are authorized to view.
Result: Trusted answers from approved sources, stronger data governance, safer self-service analytics across departments.
What we did:
  • Designed a data-source management interface for connecting approved business systems.
  • Built role-aware data access so users can ask questions only against permitted datasets.
  • Added source-health indicators, sync status, and admin controls for managing connected systems.
  • Created access boundaries to prevent users from retrieving restricted metrics or confidential records.

Milestone 3:
Chart, Table, and Export Generation

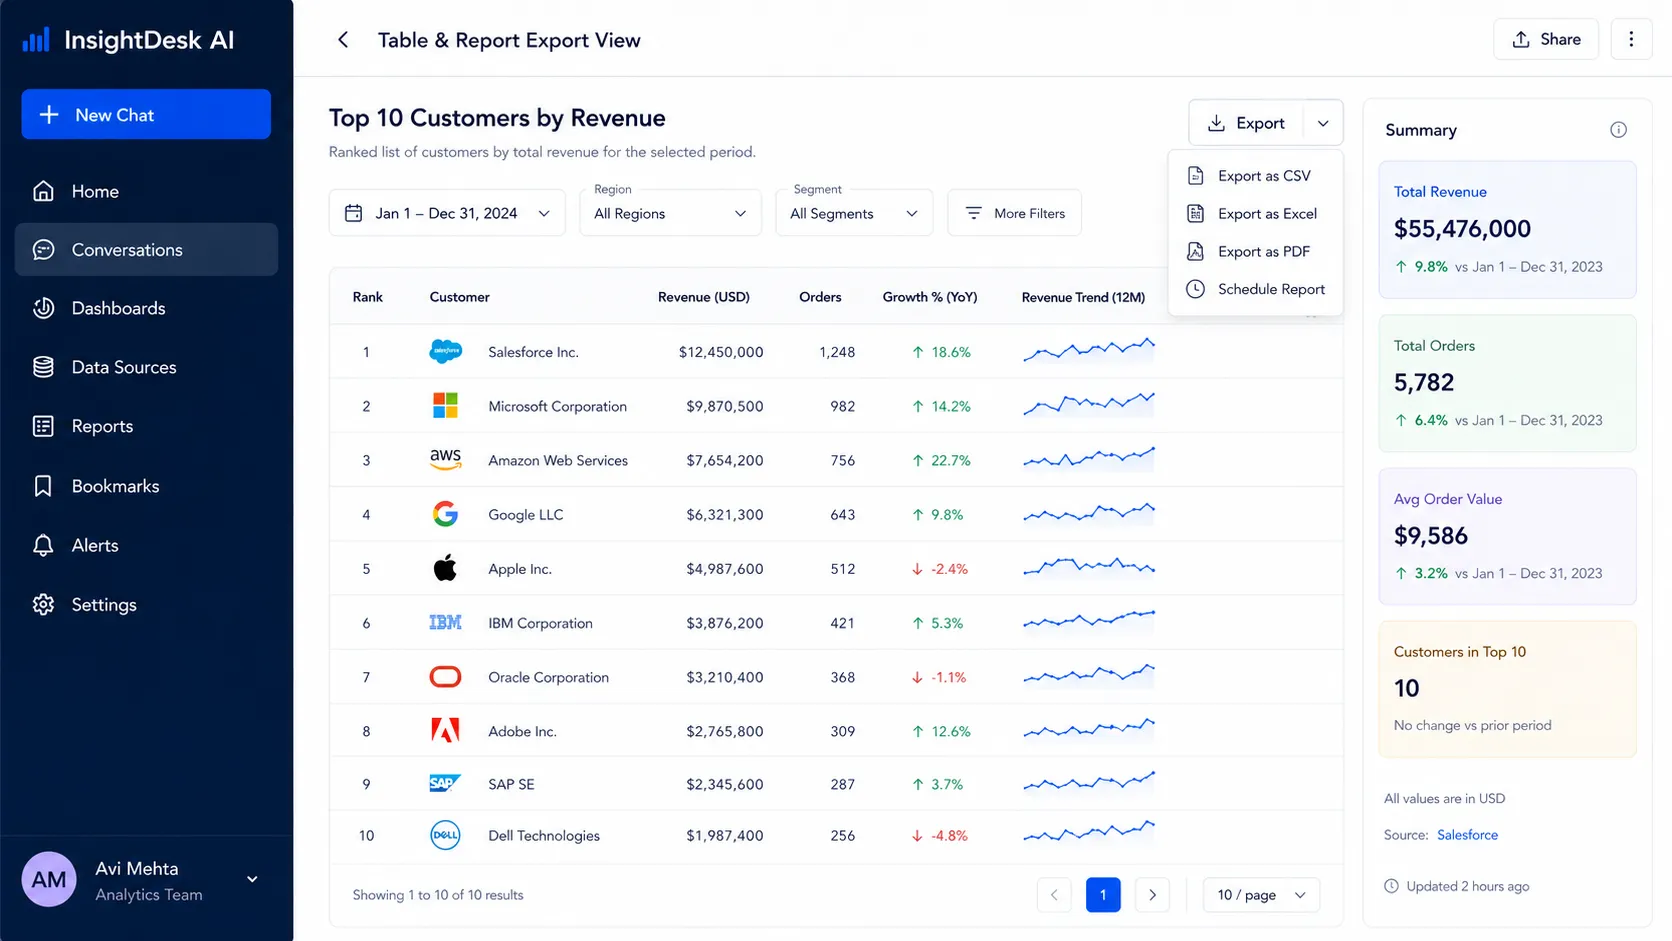
InsightDesk AI turns answers into practical outputs. Users can view results as charts, tables, summaries, and exportable files.
Instead of asking an analyst to prepare a chart or manually moving numbers into a spreadsheet, users can generate usable outputs directly from the conversation.
Result: Faster meeting preparation, reduced spreadsheet work, better presentation-ready outputs for business teams.
What we did:
  • Designed response cards with chart and table tabs for switching between visual and structured views.
  • Built chart generation for common business patterns such as trends, comparisons, rankings, and category breakdowns.
  • Added export workflows for CSV, Excel, and PDF outputs.
  • Created reusable visualization components so results stay consistent across different question types.

Milestone 4:
Multi-Turn Analysis and Context Retention

Business analysis rarely ends with the first answer. Users often ask follow-up questions such as "break this down by region," "compare with last year," or "show this as a bar chart."
InsightDesk AI supports multi-turn analysis so users can refine the same thread without repeating context.
Result: More natural data exploration, faster follow-up analysis, better continuity across business questions.
What we did:
  • Designed a conversation model where each follow-up question builds on the previous analysis.
  • Built context handling for trends, filters, segments, time periods, and comparison requests.
  • Added guardrails so the system can clarify ambiguous questions instead of guessing.
  • Created query history and saved conversation flows so users can revisit previous analysis.

Milestone 5:
Analytics Admin and AI Governance Layer

The platform becomes enterprise-ready when data and operations teams can control how AI analytics works. InsightDesk AI includes an admin layer for data-source permissions, metric definitions, prompt behavior, query logs, and governance settings.
This gives business teams self-service analytics while keeping control with authorized administrators.
Result: Safer AI analytics rollout, better control over data access, improved trust through logs and governance.
What we did:
  • Built an admin console for source management, permissions, and AI behavior configuration.
  • Added audit logs for user questions, retrieved sources, generated outputs, and exports.
  • Created metric-definition controls so teams can standardize business terms across departments.
  • Designed monitoring views for failed questions, unclear prompts, usage trends, and data-source health.

AblyCode's engineering standards applied inside InsightDesk AI

We approached InsightDesk AI as an enterprise analytics product, not as a chatbot attached to a dashboard. That means data governance, role-based access, query reliability, observability, and user trust all matter as much as the AI model itself.
1

Permission-aware analytics by default

Not every user should see every metric. We designed the platform so each query respects the user's role, dataset permissions, department boundaries, and approved source access. This prevents AI from becoming an accidental shortcut around business controls.

2

Explainability built into the response experience

Business users need to trust the answers they receive. The platform exposes the source, metric context, filters, and assumptions behind generated results. When data is incomplete or the question is unclear, the system is designed to explain the limitation instead of producing a confident but unreliable answer.

3

Conversational analytics, not one-off answers

We designed the product around multi-turn analysis. A user can start with a high-level trend, break it down by channel, compare it with another period, and export the final result. The experience is closer to working with an analyst than clicking through static dashboards.

4

Integration-first architecture and cloud-native reliability

An AI analytics platform only works when it connects to the systems where business data already lives. We designed InsightDesk AI to connect with databases, BI systems, CRMs, spreadsheets, data warehouses, and internal APIs. The platform was conceived for secure daily usage with queue-based execution, source monitoring, caching, retries, audit logs, and scalable infrastructure built in from the start.

Their ability to think beyond the AI model was critical. AblyCode understood that trust, permissions, exports, and workflow fit were just as important as generating answers. They shaped InsightDesk AI into something business users could rely on, not just experiment with.

Chief Data Officer

What the product experience looks like

The user experience is designed around business questions, not technical workflows.
A business user opens the workspace and asks a question such as "show monthly revenue by product category," "compare this quarter with last year," or "which customers had the highest growth."
The system returns a chart, table, and explanation. The user can continue with follow-ups, switch views, export the result, or save the conversation for later.
A manager sees recurring analysis threads, business summaries, and team-level insights. A data admin sees connected sources, permission rules, query logs, usage patterns, and failed-question diagnostics.
Each role gets a different control surface, but all of them work from the same governed analytics layer.

Value delivered

Faster self-service reporting

Business users can get answers without waiting for manual report preparation, reducing the dependency on analysts for common questions.

Reduced reporting time

Teams spend less time exporting spreadsheets, building charts manually, and preparing recurring summaries.

Better decision visibility

Leaders can explore performance trends, breakdowns, comparisons, and exceptions directly inside a conversational interface.

More trusted analytics adoption

Role-based access, approved sources, audit logs, and explainability help teams use AI analytics with more confidence.

Cleaner operational data habits

Because queries are routed through governed sources and standardized metrics, teams get more consistent answers across departments.

Enterprise-ready AI adoption

The platform demonstrates how generative AI can be introduced into analytics workflows with permissions, governance, monitoring, and human-readable explanations.
Call to action background
Work with us on your next project